About Our School
Patrick Murphy, Superintendent
Marianna Smith, Principal
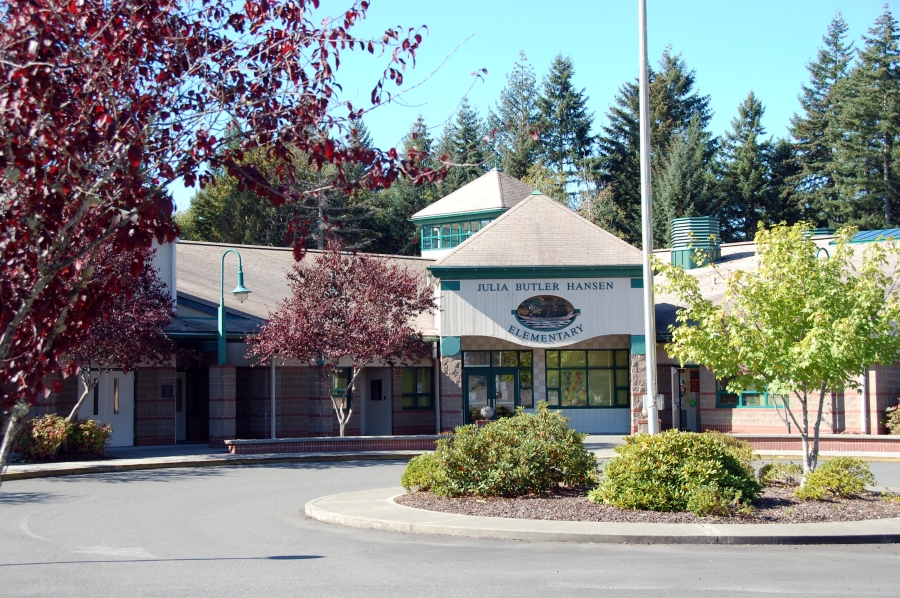
Julia Butler Hansen Elementary opened in September 1994 and is located on Olympia’s west side. Hansen was named for Congresswoman Julia Butler Hansen. The school contains three pods of four to six classrooms as well as two adjoining classrooms. The physical structure of the facility provides individual classrooms with the flexibility to allow team, multi-age and multi-year teaching situations. Separate space is also available for classroom activities and English Language Learners support. The facility includes a Learning Resource Center, Hansen Family Services Center as well as a gymnasium, multipurpose room and music room.
In September of 2017, an additional seven portables and a new 10 room mini-building will open. Hansen houses the Hansen Alternative Program (HAP), a program that emphasizes multi-age classrooms and parent involvement. Another available program for teachers is the National Board Certification, a rigorous training process that focuses on enhancing student learning.
In September of 2017, an additional seven portables and a new 10 room mini-building will open. Hansen houses the Hansen Alternative Program (HAP), a program that emphasizes multi-age classrooms and parent involvement. Another available program for teachers is the National Board Certification, a rigorous training process that focuses on enhancing student learning.
|
Student Demographics
|
| Male students |
52.9% |
| Female students |
46.9% |
| Gender X |
0.2% |
| Special Education |
25.4% |
- Number of classroom teachers: TBD
- Average years of teacher experience: 10.7
- Teachers with at least a Master's Degree: 70%
2022-23 District Operating Budget
Expenditures
|
Cost
|
Percentage
|
Teaching
|
$122,793,667
|
74.18% |
Building Administration
|
$10,620,504 |
6.42% |
| Maintenance & Operations |
$10,667,395 |
6.44% |
District Support
|
$5,113,296 |
3.09% |
Transportation
|
$4,832,295 |
2.92% |
| Technology |
$2,072,858 |
1.25% |
| Utilities & Insurance |
$5,034,198 |
3.04% |
Food Service
|
$4,206,291 |
2.54% |
| Other |
$195,070 |
0.12% |
| Total Expenditures |
$165,535,574 |
100.00% |
Revenue
|
Amount
|
Percentage
|
State
|
$116,378,657
|
71.65% |
Local
|
$31,547,262 |
19.42% |
| Federal |
$13,996,262 |
19.42% |
Other Sources
|
$511,105 |
0.31% |
| Total Revenue |
$162,433,780 |
100.00% |
Washington Comprehensive Assessment Program
Washington students participate in state tests annually to assess their progress as well as the progress of our educational system as a whole.
Our state uses the Smarter Balanced assessment system, aligned to Washington’s K-12 Learning Standards. The scores below represent the percent of students meeting standard in three core subjects, ELA, Math, and for grades 5, 8, and 11, Science (Washington Comprehensive Assessment of Science or WCAS).
2021-22 3rd Grade SBA
|
|
2022-23 3rd Grade SBA
|
|
Our School
|
Our District
|
WA State
|
|
Our School
|
Our District
|
WA State
|
| ELA |
36.2% |
47.2% |
47.4% |
|
45.5% |
53.3% |
47.7% |
Math
|
48.5% |
51.3% |
49.1% |
|
53.2% |
52.9% |
50.3% |
2021-22 4th Grade SBA
|
|
2022-23 4th Grade SBA
|
|
Our School
|
Our District
|
WA State
|
|
Our School
|
Our District
|
WA State
|
| ELA |
41% |
54.4% |
48.9% |
|
39.1% |
50.5% |
49.0% |
Math
|
46.2% |
50.1% |
45.5% |
|
48.5% |
50.7% |
48.2% |
2021-22 5th Grade SBA
|
|
2022-23 5th Grade SBA
|
|
Our School
|
Our District
|
WA State
|
|
Our School
|
Our District
|
WA State
|
| ELA |
53.7% |
55.2% |
51.6% |
|
45.1% |
57.0% |
52.5% |
Math
|
32.8% |
40.5% |
38.0% |
|
35.4% |
43.0% |
40.9% |
| Science |
53.7% |
57.9% |
50.0% |
|
52.4% |
57.5% |
50.9% |
Measures of Academic Progress (MAP)
MAP is a district assessment that measures a student's developing skills through a series of questions that adapt to the child’s level of learning. Research on MAP indicates the results are highly accurate. The results help teachers measure growth and determine whether a student may need more support or more challenge.
When students finish their MAP Growth test, they receive a number called an RIT score for each area they are tested in (reading, language usage, math, or science). This score represents a student’s achievement level at any given moment and helps measure their academic growth over time. The RIT scale is a stable scale, like feet and inches, that accurately measures student performance, regardless of age, grades, or grade level. Like marking height on a growth chart, and being able to see how tall your child is at various points in time, you can also see how much they have grown between tests.
The higher the RIT score, the more achievement the student has in the subject. The student's percentile ranking and conditional growth percentile can show how much the student has achieved in comparison with their peers. You can also refer to the Comparative Data to Inform Instructional Decisions to understand how students are performing relative to other students in the same grade level according to our national norms.
Julia Butler Hansen Elementary School Mission Statement
Hansen Elementary School is dedicated to the success of all students, which requires full partnerships with parents, community and families united in teamwork and committed to continuous growth and change as a community of learners. Through these processes, we seek to both model for and instill in our students, a value of lifelong learning and the skills necessary to be responsible, contributing citizens of our society.